November Release Updates: Jsmon Community Edition
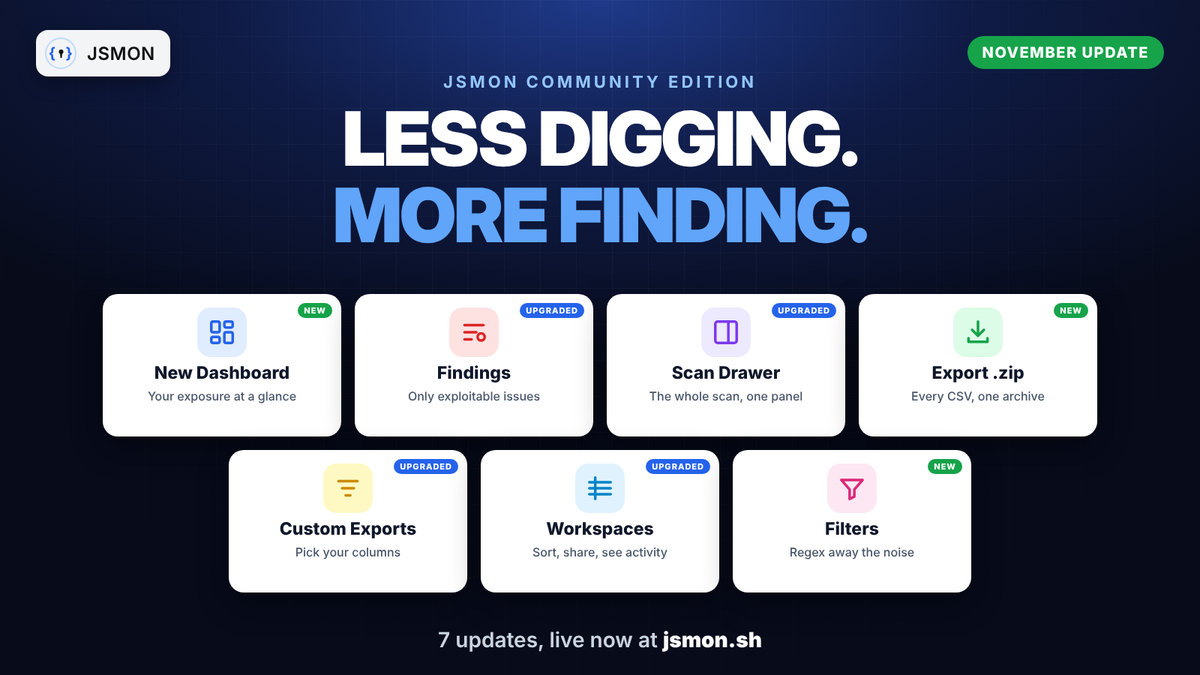
A new Dashboard, a dedicated Findings section, a scan drawer that holds the whole scan, one-click .zip exports, custom exports, redesigned Workspaces and Filters. All live now for every Jsmon user, free tier included.
Most of the time spent on recon isn't spent finding things. It's spent getting to them: jumping from Reconnaissance to Keys & Secrets to work out what a scan actually found, scrolling past the same placeholder emails and CDN domains on every target, and copying tables into spreadsheets so you can share them.
This month's release for Jsmon Community Edition goes after that time. There are seven updates. Three are new and four upgrade features you already use, and every one of them is live in your account right now, free tier included. There's nothing to turn on.
Here's what changed, starting with the one you'll notice first.
| Update | What it does | Type |
|---|---|---|
| Dashboard | Severity, open vs resolved, time to resolve, trends and findings age on one screen | New |
| Findings | A dedicated section for exploitable issues, with sorting, filters, columns and export | Upgraded |
| Scan summary drawer | URLs, every recon category, secrets and full findings in one panel | Upgraded |
| Export scan as .zip | The whole scan as CSVs, JSON and a PDF report in one archive | New |
| Custom exports | Pick the columns, scope and format of every export | Upgraded |
| Workspaces | Sortable table, sharing views and a 30-day activity graph | Upgraded |
| Filters | Regex rules that hide noise in one or all workspaces | New |
1. A new Dashboard that tells you where to look first
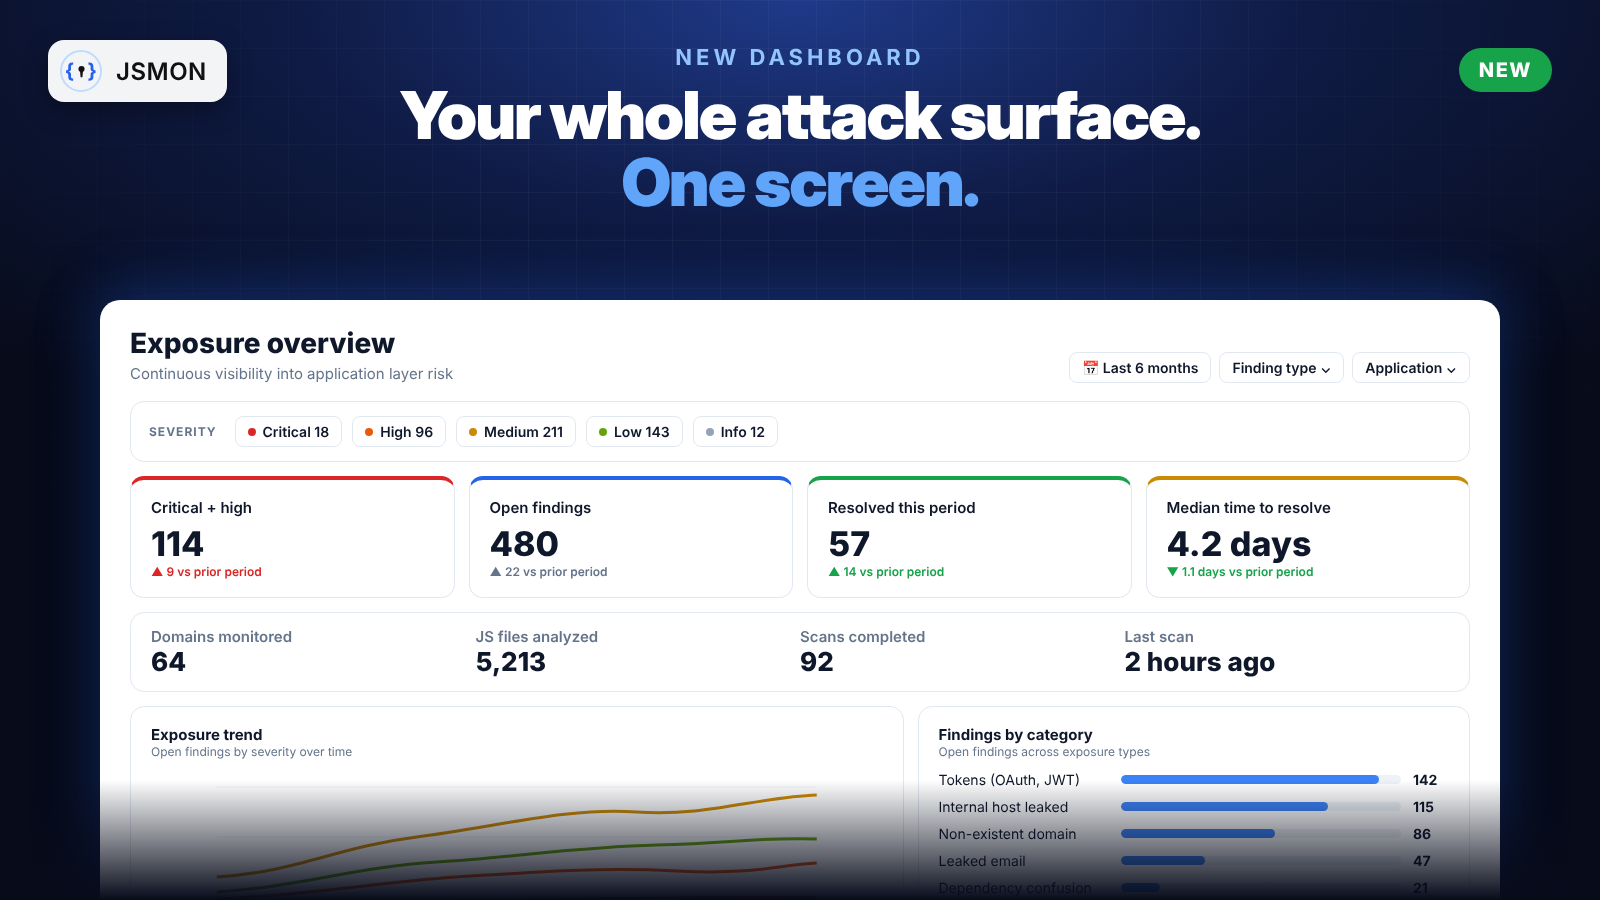
The Dashboard used to be a place where findings lived. Now it's a summary of your exposure that answers one question: if I only have ten minutes today, where should I look?
When you open a workspace, the Dashboard shows:
- Severity counts for Critical, High, Medium, Low and Info, across everything you monitor
- Critical + high, Open findings, Resolved this period and Median time to resolve, each compared with the previous period so you can see whether things are getting better or worse
- Domains monitored, JS files analyzed, Scans completed and Last scan for a quick view of coverage
- Exposure trend, a chart of open findings by severity over time
- New vs resolved findings for each scan cycle
- Top findings, a table of the highest-severity open issues with a link to the full list
- Findings by category, which shows which kinds of exposure dominate, such as leaked tokens, internal hosts, non-existent domains, leaked emails and dependency confusion
- Newly discovered, the latest findings from continuous scans
- Application exposure, which ranks your monitored domains by their highest open severity
- Findings age, which groups open findings by how long they have been unresolved: 0 to 7 days, 7 to 30 days, 30 to 90 days and more than 90 days
You can narrow the whole view by date range, finding type, application and status.
Findings age is the panel we'd look at first. It's common to find that most open findings on a workspace are more than 90 days old. That's rarely because nobody cares. It's because they were buried in a table nobody opened. Now they're on the first screen.
Try it: open any workspace and look at Findings age. How many of your open findings are older than 90 days?
2. Findings is now its own section
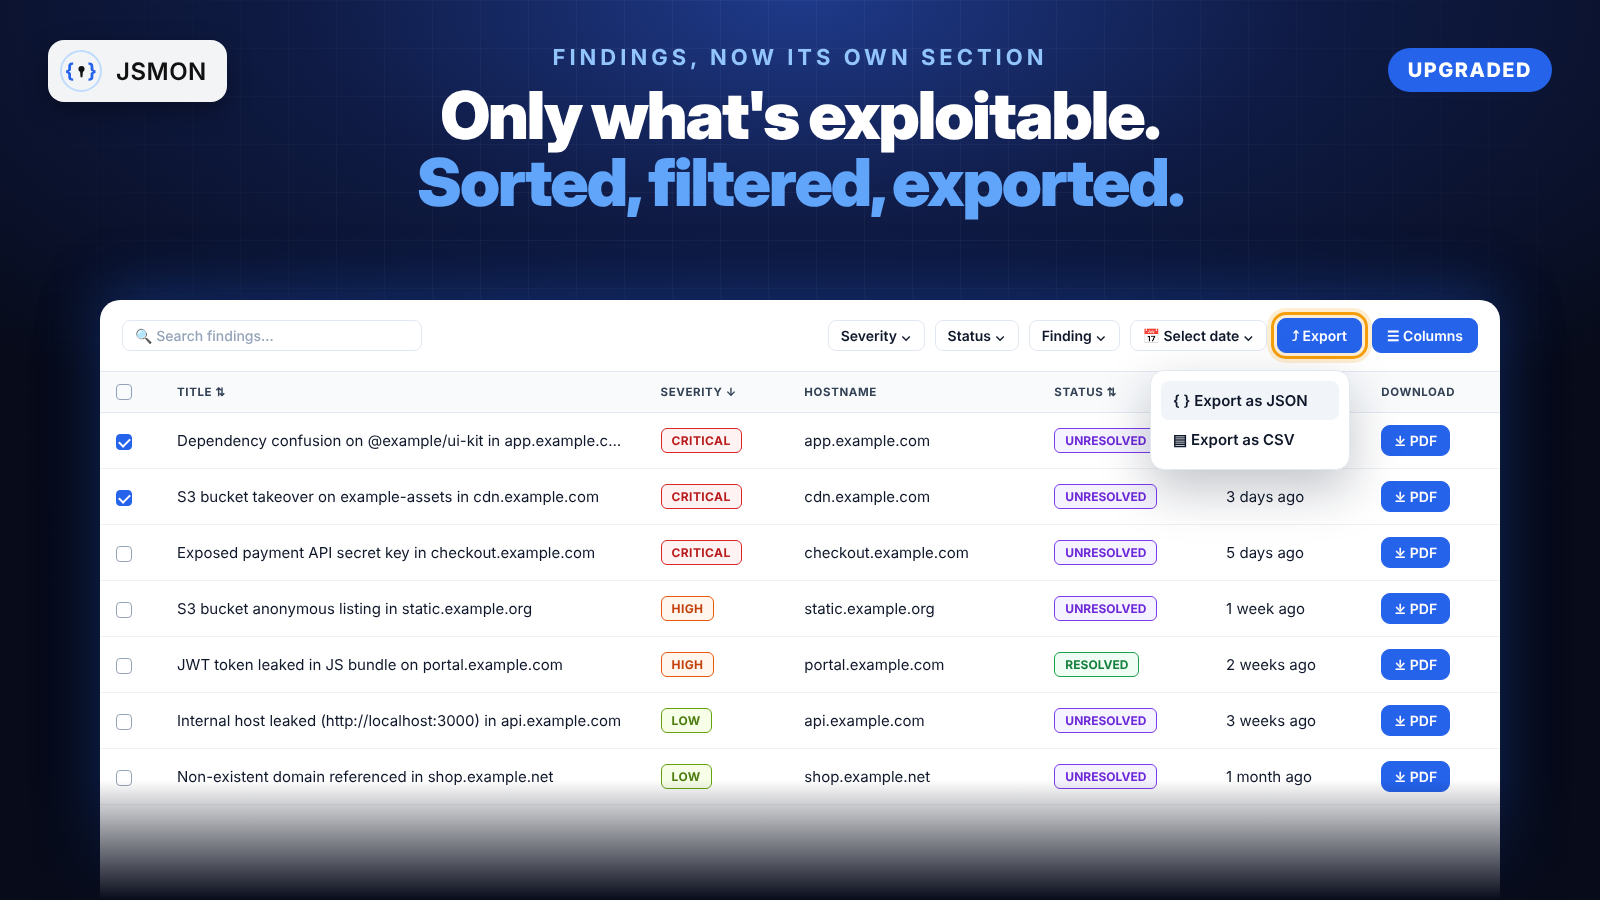
Findings used to live on the Dashboard. It now has its own place in the sidebar, and it does one job: show you only the exploitable issues that come out of your Reconnaissance and Keys & Secrets data once your URLs are scanned.
Raw recon data stays in Reconnaissance, where you can explore it. Findings is where you go when you want to report or fix something.
What you can do in Findings:
- Search findings by title, and search by domain
- Filter by severity, status, finding type and date
- Sort by title, severity, status and found-on date
- Choose your columns. Show or hide Severity, Issue, Hostname, Status, Found On and Download
- Export the list as JSON or CSV
- Download a PDF for any single finding, ready to attach to a report or a ticket
If you hunt, Findings is your shortlist of things worth reporting. If you run security for a team, it's the backlog you hand to developers.
3. The scan drawer now holds the whole scan
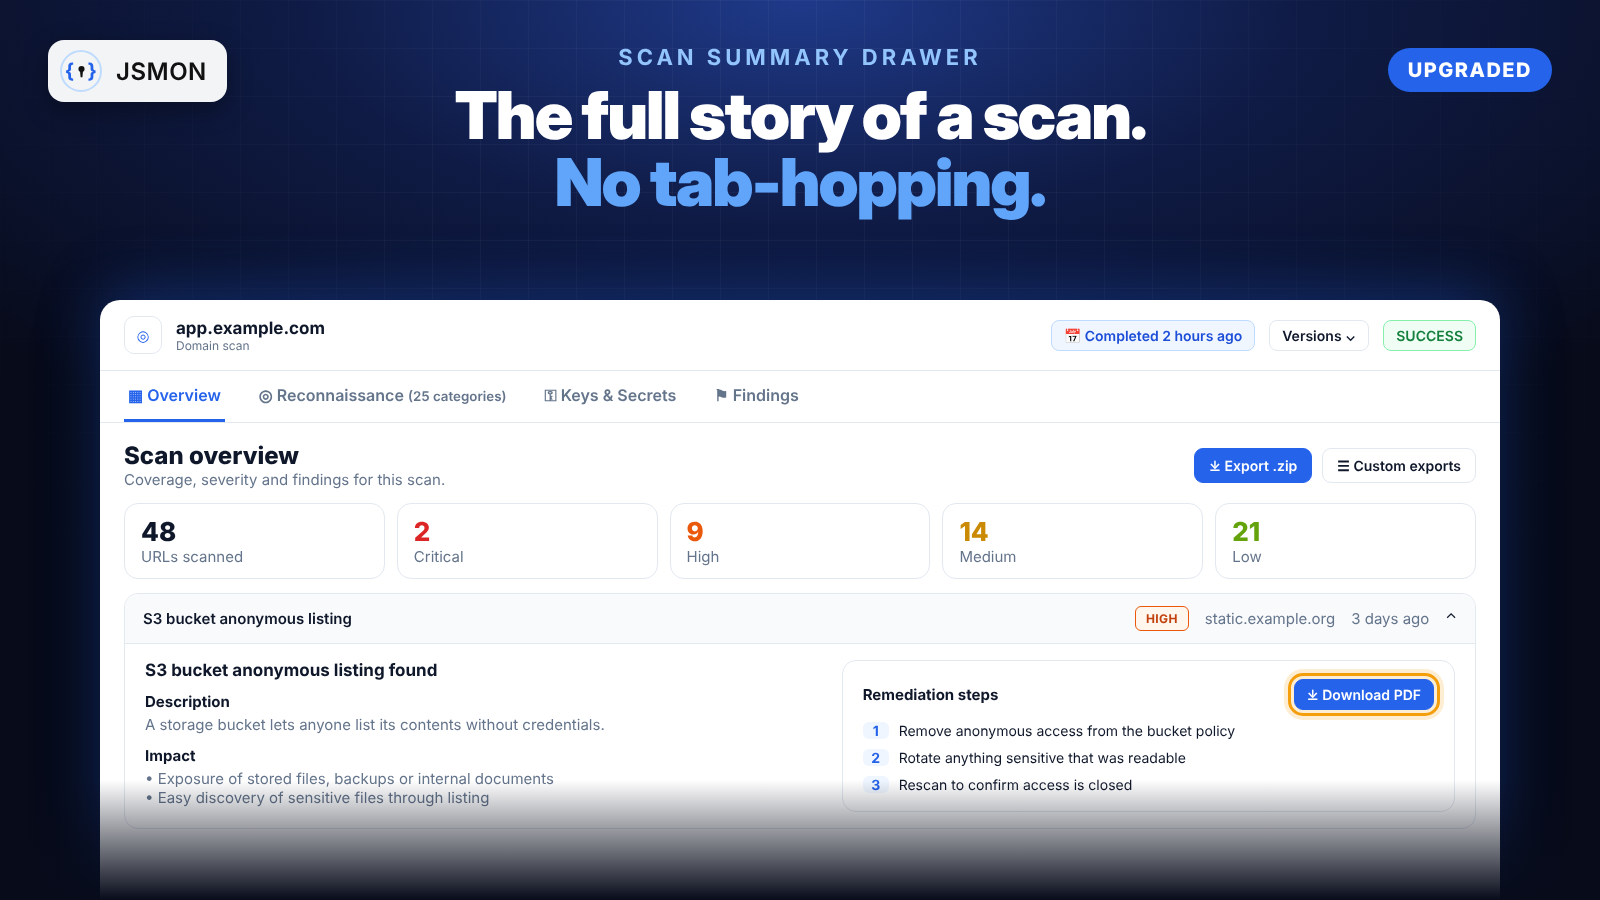
Before this release, clicking a scan opened a drawer with part of the picture. To understand what a scan had actually found, you had to leave it and go to Reconnaissance and then Keys & Secrets.
Now the scan summary drawer contains everything about that scan:
- Overview: URL coverage, scan context (depth, extensions, WAF bypass, passive extraction, headers), severity counts and the findings that need review
- Reconnaissance: every discovery category for the scan, including Scanned URLs, API Paths, Headers, URLs, Domains, Client Side Vulnerabilities, Cloud Exposures, AWS, GCP and Azure Assets, GraphQL operations and more
- Keys & Secrets: every exposed credential found in the scan
- Findings, in full. Expand any finding to see its description, its impact and step-by-step remediation, and download it as a PDF right from the drawer
You can also run custom exports from the Reconnaissance and Keys & Secrets tabs inside the drawer, for example as JSON or CSV, or with only the columns you choose (see Custom exports below).
One click on a scan now gives you the whole story, from what was crawled to how to fix what was found.
4. Export an entire scan as a .zip
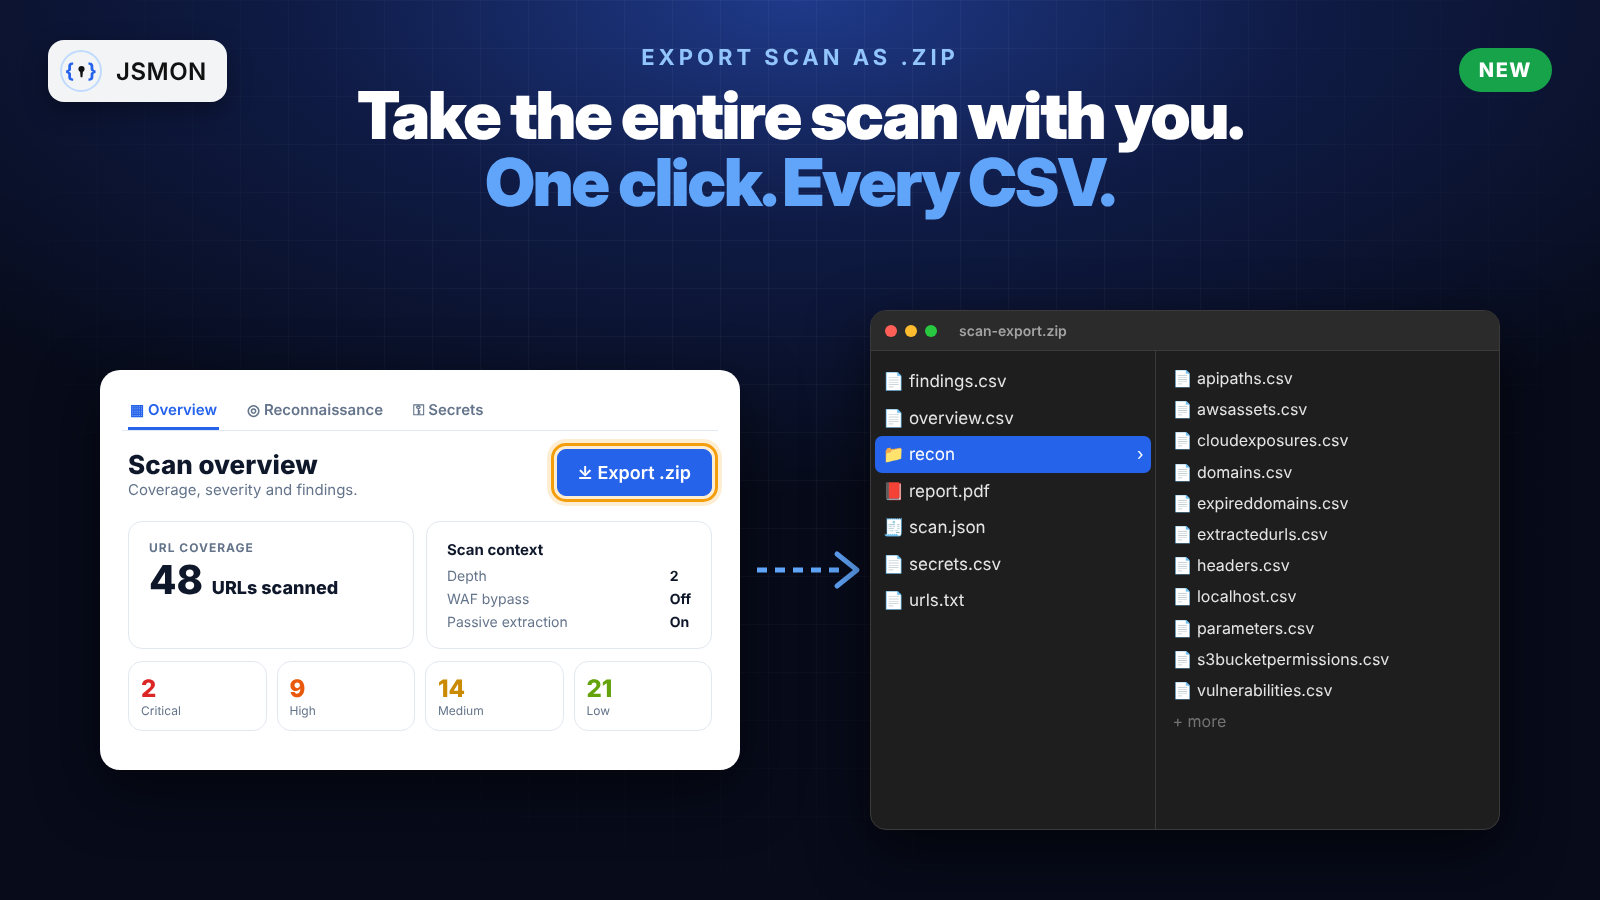
Sometimes you want the data out of Jsmon and into your own tools: a script, a spreadsheet, a diff against last week, or a report for a client.
Export .zip gives you a completed scan from top to bottom, organised the way Jsmon's services see and analyse it.
How to use it
- Open Scans and click a completed scan.
- In the Overview tab of the drawer, click Export .zip (the blue button).
- Unzip the archive.
What's inside
| File | Contents |
|---|---|
findings.csv |
Every finding from the scan |
overview.csv |
Scan summary and context |
secrets.csv |
Keys & Secrets results |
urls.txt |
Scanned URLs |
scan.json |
The full scan as raw JSON |
report.pdf |
A readable PDF report |
recon/ |
One CSV per recon category, such as apipaths.csv, awsassets.csv, cloudexposures.csv, domains.csv, expireddomains.csv, extractedurls.csv, fileextensionurls.csv, filteredporturls.csv, headers.csv, localhost.csv, parameters.csv, s3bucketpermissions.csv, socialmediaurls.csv and vulnerabilities.csv |
Because it's all plain CSV and JSON, you can grep it, load it into a notebook, compare two scans of the same target, or feed it to your own automation.
5. Custom exports: only the columns you need
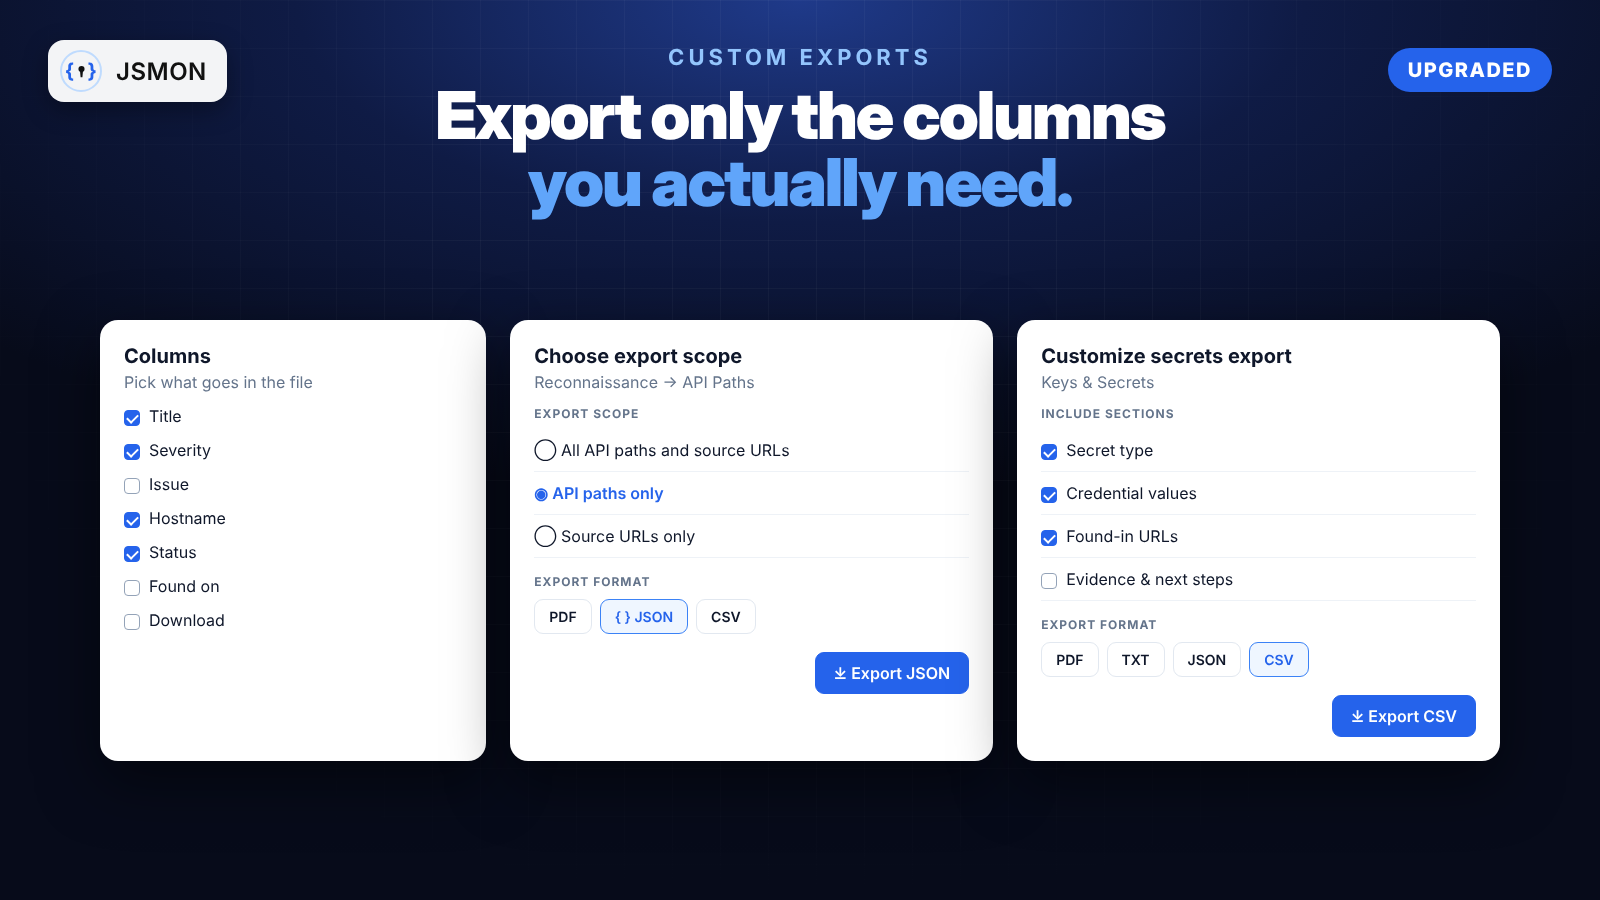
A full export is great until you have to delete twelve columns before you can use it. Exports in Jsmon now let you choose exactly what goes into the file.
- In Findings, the columns you pick are the columns you export, as JSON or CSV.
- In Reconnaissance, choose the scope of the export. For API Paths, for example, you can export all API paths and their source URLs, only the API paths, or only the source URLs. Then pick PDF, JSON or CSV.
- In Keys & Secrets, choose which sections to include (all secrets, credential values, found-in URLs, evidence and next steps) and export as PDF, TXT, JSON or CSV.
Custom exports work both on the main pages and inside the scan drawer, so you can export a single scan's API paths without leaving it.
TXT export is available for Keys & Secrets today. TXT export for the main values of Reconnaissance categories is coming next.
6. Workspaces, rebuilt as a table with activity
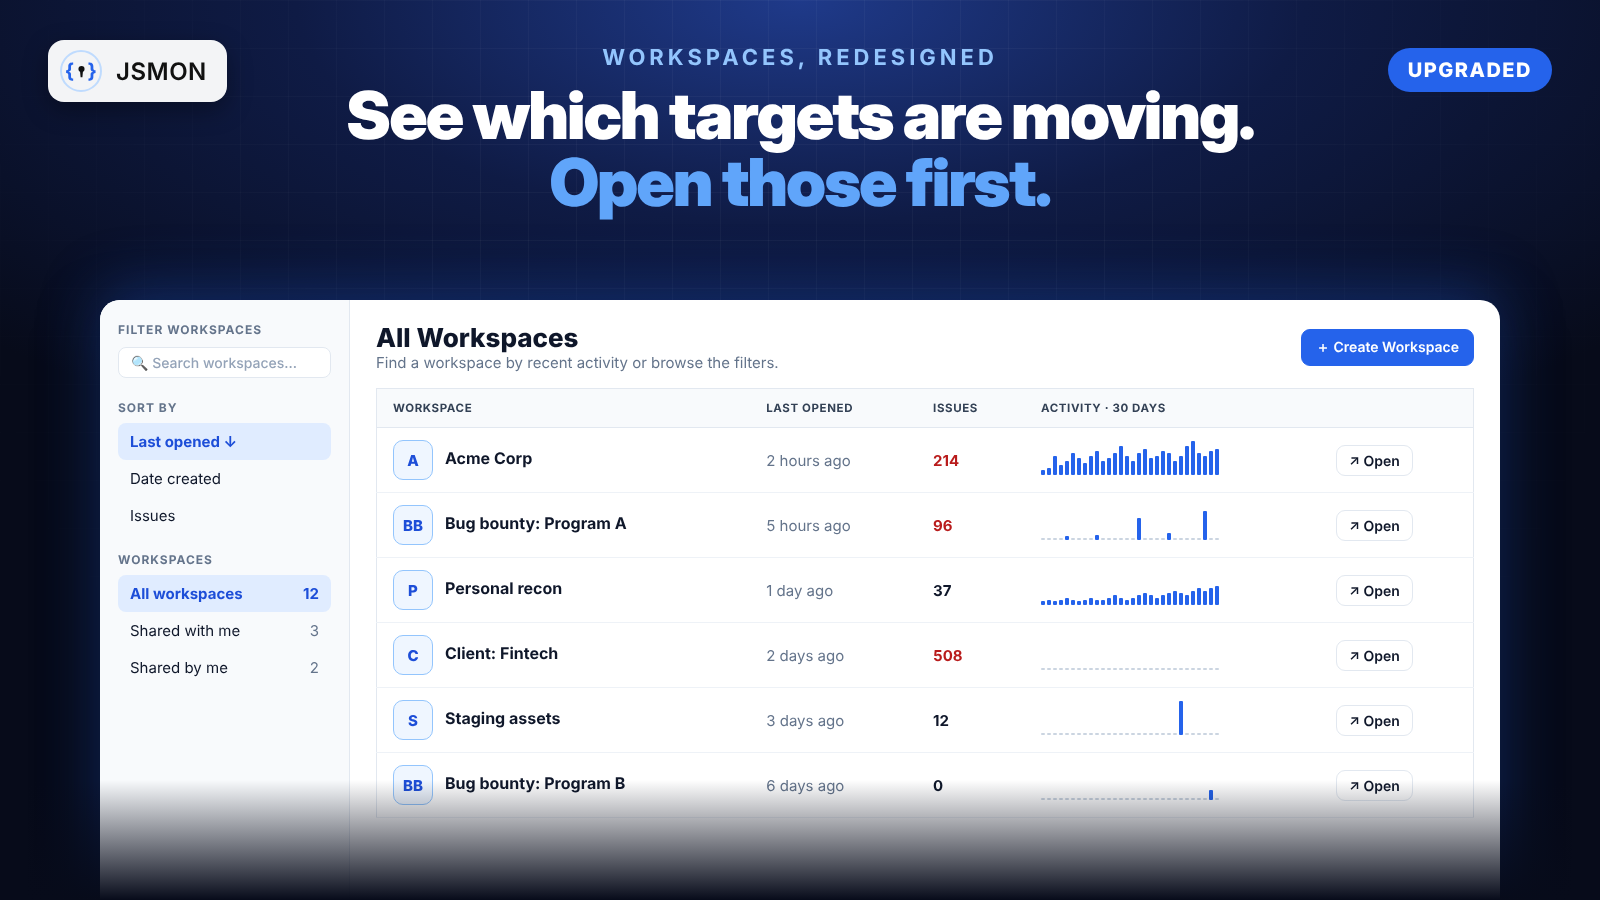
Workspaces used to be a stack of cards. With more than a handful of targets, finding the one you needed meant scrolling. The page is now a table that's built to be scanned quickly.
- Sort by last opened, date created or number of issues
- Search workspaces by name and filter by created date
- Switch between All workspaces, Shared with me and Shared by me
- See each workspace's issue count at a glance
- See a 30-day activity graph for every workspace
The activity graph is the best part. It shows how many new URLs and files Jsmon analysed in each workspace over the last 30 days. A spike means a target shipped something new, which is often exactly when new bugs appear. Open those workspaces first.
7. Filters: hide the noise once
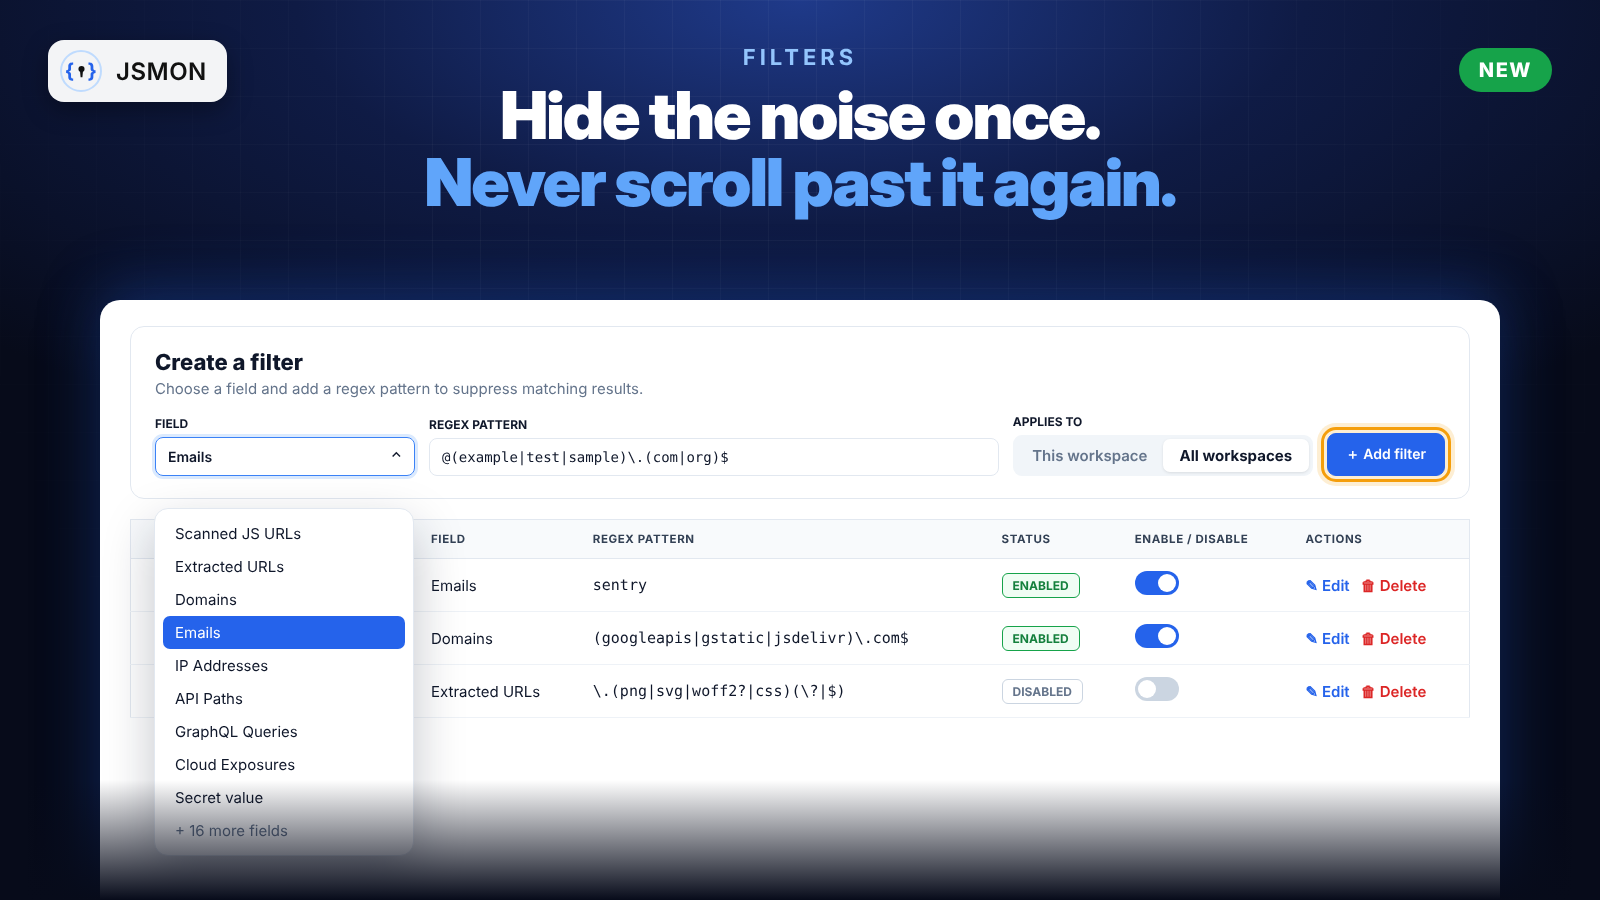
Every JavaScript scan picks up noise: placeholder emails like [email protected], CDN domains, font and image URLs, Sentry addresses. Filters let you hide them once and stop scrolling past them.
- Open Filters in the sidebar.
- Pick a Field, such as Emails, Domains, Extracted URLs, Scanned URLs, IP Addresses, API Paths, Cloud Exposures, Secret value and many more.
- Enter a regex pattern, for example
@(example|test|sample)\.(com|org)$. - Choose whether it applies to this workspace or all workspaces, then click Add filter.
Matching values are hidden straight away. Filters only change what you see. Your scan data is never deleted, and you can switch any filter off with a toggle. For starter patterns, see the Filters docs.
Try it on your next scan
The quickest way to see all of this together takes about a minute:
- Open Workspaces and pick the one with the most recent activity.
- Check the Dashboard, especially Findings age.
- Open Scans, click your latest completed scan and read the drawer from Overview to Findings.
- Hit Export .zip and open the archive.
Found something with these updates, have an idea, or hit a bug? Tell us in the Jsmon Discord or reply to our newsletter. We read everything, and a lot of this release came from your feedback.
The Jsmon team