How We Shrunk Our 3.4 TB PostgreSQL Database by 85% - A Migration Story
Migrating and Shrinking Jsmon's PostgreSQL DB from 3.4 TB to 517 GB. At Jsmon, our Application Exposure Intelligence platform scans millions of domains and processes billions of JavaScript intelligence signals
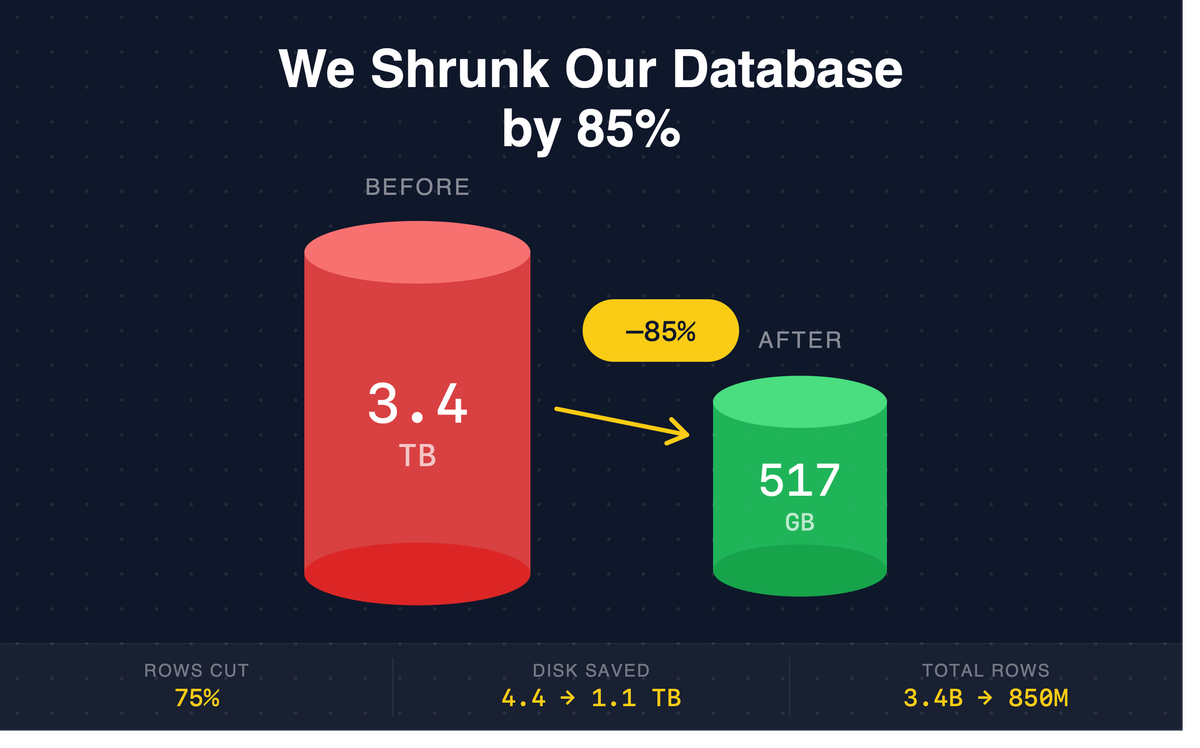
At Jsmon, our Application Exposure Intelligence platform scans millions of domains and processes billions of JavaScript intelligence signals: API endpoints, secrets, GraphQL operations, subdomains, and more. Over time, that volume compounded into a database that had quietly ballooned to 3.4 terabytes and 3.4 billion rows.
This is the story of how we migrated, restructured, and compressed it down to 517 GB and 850 million rows — cutting our storage footprint by 85% and our cloud disk costs by 75%.
The Problem: A Database That Outgrew Its Design
Our production PostgreSQL instance had reached a point where the numbers spoke for themselves:
| Metric | Before Migration |
|---|---|
| Database size | 3,418 GB (3.4 TB) |
| Provisioned disk | 4.4 TB |
| Estimated rows | ~3.4 billion |
| Tables | 93 |
| Indexes | 321 |
The single largest table — automation_result_values — held 3.13 billion rows and occupied 2,362 GB on its own. That's 69% of the entire database living in one table.
Here's what the top 5 tables looked like before migration:
| Table | Rows | Total Size |
|---|---|---|
automation_result_values | 3,133,463,233 | 2,362 GB |
automation_result_objects | 430,957,504 | 423 GB |
arv_extracted_urls | 465,387,402 | 238 GB |
arv_file_extension_urls | 236,918,394 | 122 GB |
arv_extracted_parameters_url | 106,685,652 | 62 GB |
And the top 5 indexes by size:
| Index | Table | Size |
|---|---|---|
automation_result_values_pkey | automation_result_values | 116 GB |
arv_extracted_urls_value_text_idx | arv_extracted_urls | 101 GB |
idx_arv_wksp_facet_subfacet_value_small | automation_result_values | 64 GB |
idx_arv_wksp_jsmon_facet | automation_result_values | 54 GB |
arv_file_extension_urls_value_text_idx | arv_file_extension_urls | 48 GB |
Three of the top five indexes belonged to one table. We were spending hundreds of gigabytes just keeping automation_result_values queryable.
Why This Matters Beyond Disk Space
A 3.4 TB database isn't just a storage bill problem. It affects everything:
- Backup duration —
pg_dumpon a multi-terabyte DB takes hours. Restores take even longer. - Replication lag — streaming replication has to push every write across the wire.
- VACUUM overhead — autovacuum on a 3-billion-row table is a beast. Our dead-tuple ratios were growing.
- Query planning — the planner makes different (often worse) decisions when table statistics span billions of rows.
- Cloud costs — provisioned IOPS and storage on managed Postgres (RDS, Cloud SQL, etc.) scale linearly with disk size. We were paying for 4.4 TB of provisioned SSD.
What We Did
The migration wasn't a simple pg_dump and restore. It was a structural redesign of how we store scan intelligence.
The Core Change: Eliminating the Monolith Table
automation_result_values was our catch-all. Every scan finding — URLs, API paths, headers, secrets, domains, parameters — was stored as a row in this single table with a facet column to distinguish types. At 3.13 billion rows, it had become the bottleneck for reads, writes, indexes, and maintenance.
We broke it apart. Each intelligence type now lives in its own dedicated table (arv_extracted_urls_final, arv_api_paths_final, arv_headers_final, etc.), with schemas tailored to their specific data shapes. This let us:
- Drop redundant columns that only applied to certain facets
- Build targeted indexes instead of bloated composite indexes trying to serve every query pattern
- Deduplicate aggressively within each facet — the same URL discovered across 100 scans doesn't need 100 rows anymore
- Eliminate the 430M-row
automation_result_objectsparent table entirely
Deduplication at Scale
A huge portion of the 3.4 billion rows were duplicates — the same extracted URL, the same API endpoint, the same header value discovered repeatedly across scans of the same domain over time. Our old schema stored every occurrence. The new schema stores unique values and references them, cutting billions of redundant rows.
The Results
| Metric | Before | After | Reduction |
|---|---|---|---|
| Database size | 3,418 GB | 517 GB | 84.9% |
| Provisioned disk | 4.4 TB | 1.1 TB | 75% |
| Estimated rows | ~3.4 billion | ~850 million | 75% |
| Tables | 93 | 90 | 3 dropped |
| Indexes | 321 | 309 | 12 removed |
Top 5 Tables — After Migration
| Table | Total Size |
|---|---|
arv_extracted_urls_final | 193 GB |
arv_file_extension_urls_final | 94 GB |
aro_extracted_parameters | 48 GB |
arv_extracted_parameters_url_final | 42 GB |
arv_api_paths_final | 28 GB |
The largest table is now 193 GB — down from 2,362 GB. There is no single table dominating the database anymore.
The Monolith Table: Gone
| Before | After | |
|---|---|---|
automation_result_values | 3.13B rows, 2,362 GB | Eliminated |
automation_result_objects | 430M rows, 423 GB | Eliminated |
These two tables alone accounted for 2,785 GB — 81% of the old database. They no longer exist.
Cloud Cost Impact
Database storage is one of the most expensive line items in any cloud bill, and it compounds — you pay for the disk, the IOPS, the backups, the snapshots, and the cross-region replication of all of it.
Direct Storage Savings
With provisioned disk dropping from 4.4 TB to 1.1 TB, we're looking at a 75% reduction in raw storage costs. On AWS RDS (gp3), that's roughly:
| Before | After | Monthly Savings | |
|---|---|---|---|
| Storage (gp3 @ $0.08/GB) | ~$352/mo | ~$88/mo | ~$264/mo |
| Backup storage | Proportional to 4.4 TB | Proportional to 1.1 TB | ~75% less |
| Snapshot costs | 4.4 TB per snap | 1.1 TB per snap | ~75% less |
Note: Actual costs vary by region, IOPS provisioning, and multi-AZ configuration. These are illustrative estimates based on us-east-1 gp3 pricing.
Indirect Savings
The cost wins go beyond the storage line item:
- Faster backups — a 517 GB database backs up in a fraction of the time a 3.4 TB one does. Less backup window = less IOPS contention with production traffic.
- Faster restores and failovers — disaster recovery time drops proportionally. A 75% smaller database means a 75% faster RTO.
- Lower replication costs — less data to replicate across AZs or regions.
- Reduced IOPS pressure — fewer rows means fewer pages to scan, less buffer cache pressure, and fewer IOPS consumed by maintenance operations like VACUUM.
- Smaller dev/staging environments — every non-production copy of the database also shrinks by 85%, compounding the savings across environments.
Projected Annual Savings
Even conservatively — counting only direct storage, backup, and the IOPS headroom we freed up — this migration saves us an estimated $3,000–5,000+ per year in infrastructure costs. For a startup, that's meaningful runway.
What We Learned
1. Monolith tables are a silent killer. A single table holding 69% of your database is a design smell. It works at 10 million rows. It's painful at 100 million. At 3 billion, it's an emergency.
2. Deduplication is the biggest lever. We didn't delete data — we deduplicated it. The same intelligence is still queryable; it's just not stored N times anymore.
3. Indexes compound the problem. automation_result_values had indexes totaling 234 GB — more than the entire post-migration database. Every index on a bloated table is bloated itself.
4. Migration is a design opportunity. We didn't just move data from old tables to new tables. We redesigned the schema to match how the data is actually queried, which made the migration a performance upgrade, not just a cleanup.
5. Measure everything before you start. Having precise before/after numbers (row counts, table sizes, index sizes, access patterns) made it possible to validate the migration and write this post. Run pg_stat_user_tables and pg_stat_user_indexes before you touch anything.
The Numbers, One More Time
| Before | After | Change | |
|---|---|---|---|
| Database size | 3,418 GB | 517 GB | ↓ 85% |
| Disk provisioned | 4.4 TB | 1.1 TB | ↓ 75% |
| Total rows | ~3.4B | ~850M | ↓ 75% |
| Largest table | 2,362 GB | 193 GB | ↓ 92% |
| Tables | 93 | 90 | ↓ 3 |
| Indexes | 321 | 309 | ↓ 12 |
From 3.4 billion rows across 93 tables and 3.4 terabytes of PostgreSQL — down to 850 million rows, 517 GB, and a database that breathes again.
We're Jsmon — an Application Exposure Intelligence platform that monitors the internet-facing layer of your external attack surface. If you're interested in what we're building, check us out.