What is Django Debug Mode Exposure? Ways to Exploit, Examples and Impact
When a developer builds a web application using the Django framework, one of the most useful tools at their disposal is the built-in debug mode. It provides detailed error reports, stack traces, and local variable states that make troubleshooting a breeze. However, if this feature is accidentally left active in a production environment, it transforms from a helpful assistant into a catastrophic security vulnerability. In this post, we will explore exactly what Django Debug Mode exposure is, why it is so dangerous, and how attackers exploit it to compromise entire servers.
What is Django Debug Mode Exposure?
Django is a high-level Python web framework that encourages rapid development and clean, pragmatic design. To help developers find bugs, Django includes a setting in its configuration file (settings.py) called DEBUG. By default, when you start a new project, DEBUG is set to True.
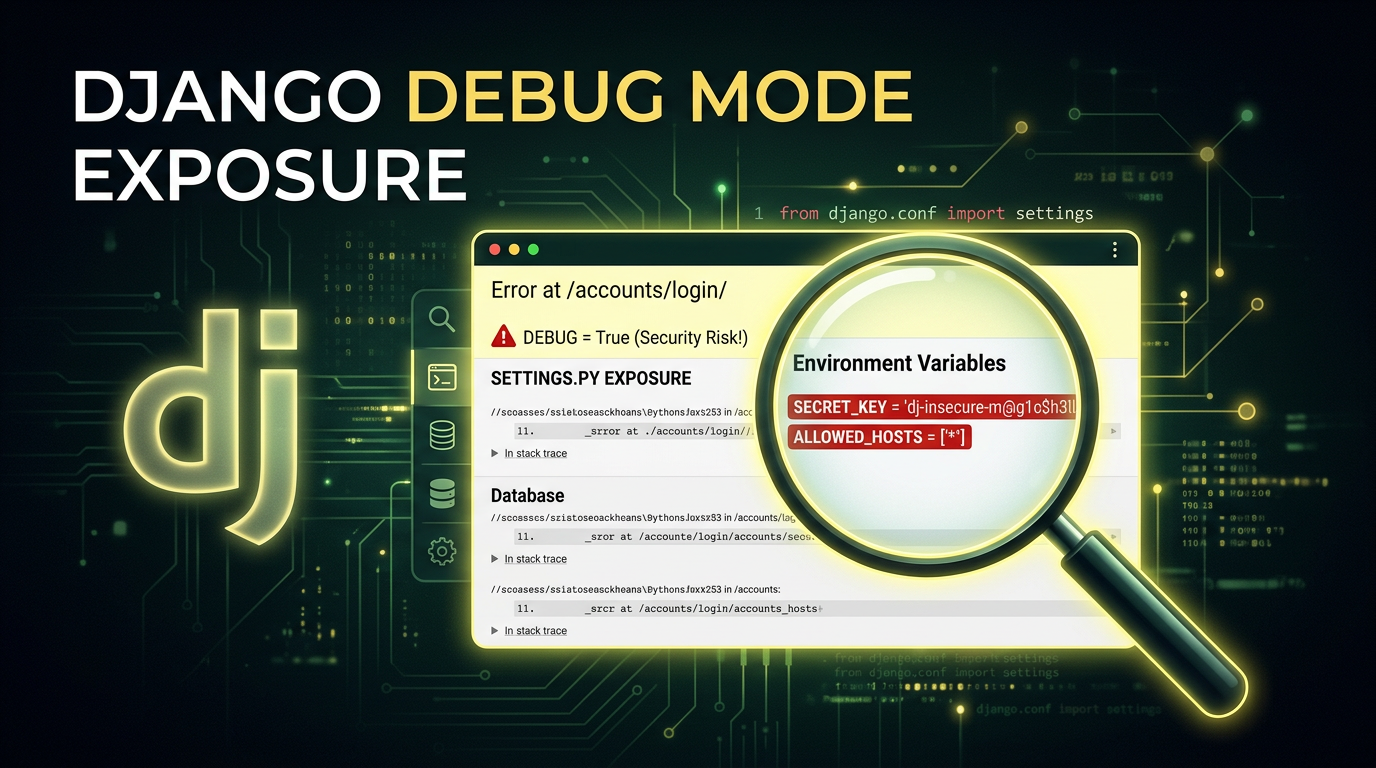
When DEBUG = True, any time the application encounters an error—such as a 404 Not Found or a 500 Internal Server Error—Django generates a highly detailed "Technical Response" page. This page, often referred to by developers as the "Yellow Screen of Death," contains an immense amount of information intended for the developer's eyes only.
Exposure occurs when this setting is not changed to False before the application is deployed to a live, public-facing server. When an attacker or a casual user triggers an error on a production site with DEBUG enabled, they are presented with a roadmap of the application's internal structure, configuration, and sensitive secrets.
The Anatomy of a Debug Page
To understand the risk, we must look at what is actually displayed on a Django debug page. The exposure typically includes:
- Full Stack Traces: A step-by-step list of every function call and code file involved in the crash. This reveals the internal directory structure of the server (e.g.,
/home/ubuntu/project/app/views.py). - Local Variables: For every frame in the stack trace, Django displays the values of all local variables at the time of the error. This often includes user data, session tokens, or intermediate calculation results.
- Environment Variables: The debug page lists all environment variables accessible to the Python process. This is a common place where developers store API keys, database credentials, and cloud provider secrets.
- Settings Configuration: A full dump of the
settings.pyconfiguration. While Django tries to mask some sensitive keys (like anything containing "PASSWORD" or "SECRET"), this masking is not foolproof and often misses custom configuration names. - SQL Queries: If the error occurs during a database operation, the debug page may show the exact SQL queries being executed, revealing table names and database logic.
- Installed Apps and Middleware: A list of every library and middleware the application uses, which helps an attacker identify specific versions of software that might have known vulnerabilities (CVEs).
Why Do Developers Leave Debug Mode On?
It might seem like an obvious mistake, but Django Debug Mode exposure is incredibly common. There are several reasons why this happens:
- Configuration Oversights: A developer might forget to toggle the boolean value before a quick deployment.
- Environment Variable Failures: Many teams use an environment variable like
DEBUG=Falsein production. If the environment variable fails to load or is misspelled, the application might default toTruefor safety during development, which is unsafe for production. - Container Misconfiguration: In Dockerized environments, the image might be built with development settings baked in, and the production overrides might not be applied correctly.
- Lack of Automated Testing: If the deployment pipeline doesn't specifically check for the
DEBUGstate, the error can easily slip through to the live site.
How to Find Django Debug Mode Exposure
Finding an exposed debug mode is often the first step in a reconnaissance phase for an attacker. It is trivial to identify.
Manual Identification
The simplest way to check is to request a URL that clearly does not exist on the target website, such as https://example.com/this-path-does-not-exist-12345.
If the server returns a generic 404 page, the site is likely configured correctly. However, if the server returns a page titled "Page not found (404)" with a list of every URL pattern defined in the application's urls.py, then DEBUG is set to True.
Automated Scanning
Security professionals and attackers alike use automated tools to find these exposures at scale. Since the debug page has unique strings like "Traceback (most recent call last)" and "Request Method: GET", it is easy to fingerprint. Tools like Jsmon can be used to monitor your infrastructure and alert you the moment a configuration change results in a sensitive page like this becoming public.
Exploiting Django Debug Mode: Real-World Scenarios
Once an attacker finds an exposed debug page, the "exploitation" isn't just about looking at the screen; it's about using the information found there to pivot deeper into the infrastructure.
Scenario 1: Database Credential Theft
An attacker triggers a DatabaseError by sending a malformed query or a character that the application doesn't handle correctly. The resulting debug page reveals the DATABASES dictionary from settings.py.
# What the attacker sees in the debug page:
DATABASES = {
    'default': {
        'ENGINE': 'django.db.backends.postgresql',
        'NAME': 'prod_db',
        'USER': 'admin_user',
        'PASSWORD': 'SuperSecretPassword123!',
        'HOST': 'db.internal.example.com',
        'PORT': '5432',
    }
}
Even if the database is not publicly accessible, the attacker now has credentials they can use if they find a way into the internal network or if the database is hosted on a cloud service with a misconfigured firewall.
Scenario 2: Remote Code Execution (RCE) via SECRET_KEY
This is the holy grail for attackers. Django uses a SECRET_KEY for cryptographic signing. This key is used to sign session cookies, CSRF tokens, and password reset tokens. If the SECRET_KEY is leaked on the debug page (which it often is, as it is a standard part of settings.py), the security of the entire application is compromised.
In older versions of Django, or applications using the PickleSerializer for sessions, an attacker can use the leaked SECRET_KEY to forge a malicious session cookie containing a "pickled" Python object. When the server deserializes this cookie, it executes the attacker's code.
Even in modern Django versions using JSONSerializer, the SECRET_KEY allows an attacker to:
- Forge session cookies to log in as any user, including administrators.
- Bypass CSRF protections.
- Decrypt or manipulate any data signed by the application.
Scenario 3: Source Code and Logic Disclosure
By examining the stack trace, an attacker can see snippets of the actual Python source code. This helps them understand the business logic, find hidden API endpoints, and identify other vulnerabilities like SQL Injection or Insecure Direct Object References (IDOR) that were not previously obvious.
Technical Example: Triggering the Exposure
Suppose a developer has a view that takes an integer ID from the URL:
# views.py
def user_profile(request, user_id):
    user = User.objects.get(id=user_id)
    return render(request, 'profile.html', {'user': user})
An attacker could navigate to /users/not-an-integer/. Because the code expects an integer, it will throw a ValueError or a Http404 depending on the URL configuration. If DEBUG = True, Django will render the full traceback.
In the "Local vars" section of the traceback for the user_profile function, the attacker might see the request object. Expanding this object reveals the META dictionary, which contains server headers, internal IP addresses, and potentially sensitive environment variables passed through the web server (like Gunicorn or Nginx).
How to Prevent Django Debug Mode Exposure
Securing your Django application against this exposure requires a multi-layered approach to configuration management.
1. Hardcode DEBUG to False in Production
In your production-specific settings file, ensure the line is explicitly set:
# settings_production.py
DEBUG = False
2. Use Environment Variables Safely
Instead of hardcoding the value, use an environment variable but provide a safe default. In Python, os.environ.get() returns None if the variable isn't set. You should ensure that any value other than a specific "True" string results in DEBUG = False.
import os

# Safely load DEBUG from environment
DEBUG = os.environ.get('DJANGO_DEBUG', 'False') == 'True'
3. Configure ALLOWED_HOSTS
When DEBUG is set to False, Django requires you to set the ALLOWED_HOSTS setting. This is a security feature that prevents HTTP Host header attacks. If you turn off debug mode but forget to set this, your site will return a 400 Bad Request error.
ALLOWED_HOSTS = ['example.com', 'www.example.com', '10.0.0.5']
4. Custom Error Templates
Even with DEBUG = False, you should provide custom templates for 404 and 500 errors. This ensures that even if something goes wrong, the user sees a branded, helpful message rather than a default web server error page that might still leak minor details like the server version (e.g., "nginx/1.18.0").
Create a 404.html and 500.html in your templates directory. Django will automatically use these when DEBUG = False.
5. Automated Infrastructure Monitoring
Misconfigurations happen. A developer might change a setting for a quick hotfix and forget to revert it. This is where attack surface management comes in. By using tools that perform continuous reconnaissance, you can detect when a debug page becomes accessible to the public.
Impact Assessment
The impact of Django Debug Mode exposure is almost always classified as Critical. It is a direct violation of the principle of least privilege and results in immediate Information Disclosure. Depending on the secrets stored in the environment and the version of Django in use, it frequently leads to full Server Takeover (RCE) or total Database Compromise.
For organizations, the fallout includes:
- Data Breaches: Exposure of customer PII (Personally Identifiable Information).
- Reputational Damage: Losing the trust of users who expect their data to be handled securely.
- Compliance Violations: Failing audits for standards like PCI-DSS, SOC2, or GDPR, which strictly forbid the exposure of sensitive configuration data in production.
Conclusion
Django Debug Mode is a powerful feature for development, but it is a lethal vulnerability in production. It provides attackers with everything they need to move from an external observer to an internal threat actor. By understanding how these pages are triggered and what information they leak, developers can better appreciate the necessity of strict environment separation and robust deployment pipelines.
To proactively monitor your organization's external attack surface and catch exposures like Django Debug Mode before attackers do, try Jsmon.