How to Perform JavaScript Reconnaissance for Bug Bounties

If you've spent any time doing reconnaissance, you know the drill: subdomain enumeration, port scanning, directory brute-forcing. These techniques work, sure, but they only show you what's live and responding right now. They don't reveal the bigger picture.
Here's what most people miss: modern web applications are essentially handing you their blueprint. Every time someone loads a React, Vue, or Angular app, the server sends over a massive JavaScript bundle that contains way more than just UI logic. It's got API endpoints, internal URLs, configuration details, and sometimes even hardcoded secrets. All sitting there in plain sight.
This guide is about shifting from "brute force everything" to "read the map they're giving you." Let's talk about how to turn those messy JavaScript files into a complete picture of your target's infrastructure.
The Importance of JavaScript Analysis in Reconnaissance
DNS records and port scans will only get you so far. JavaScript files? They tell a story.
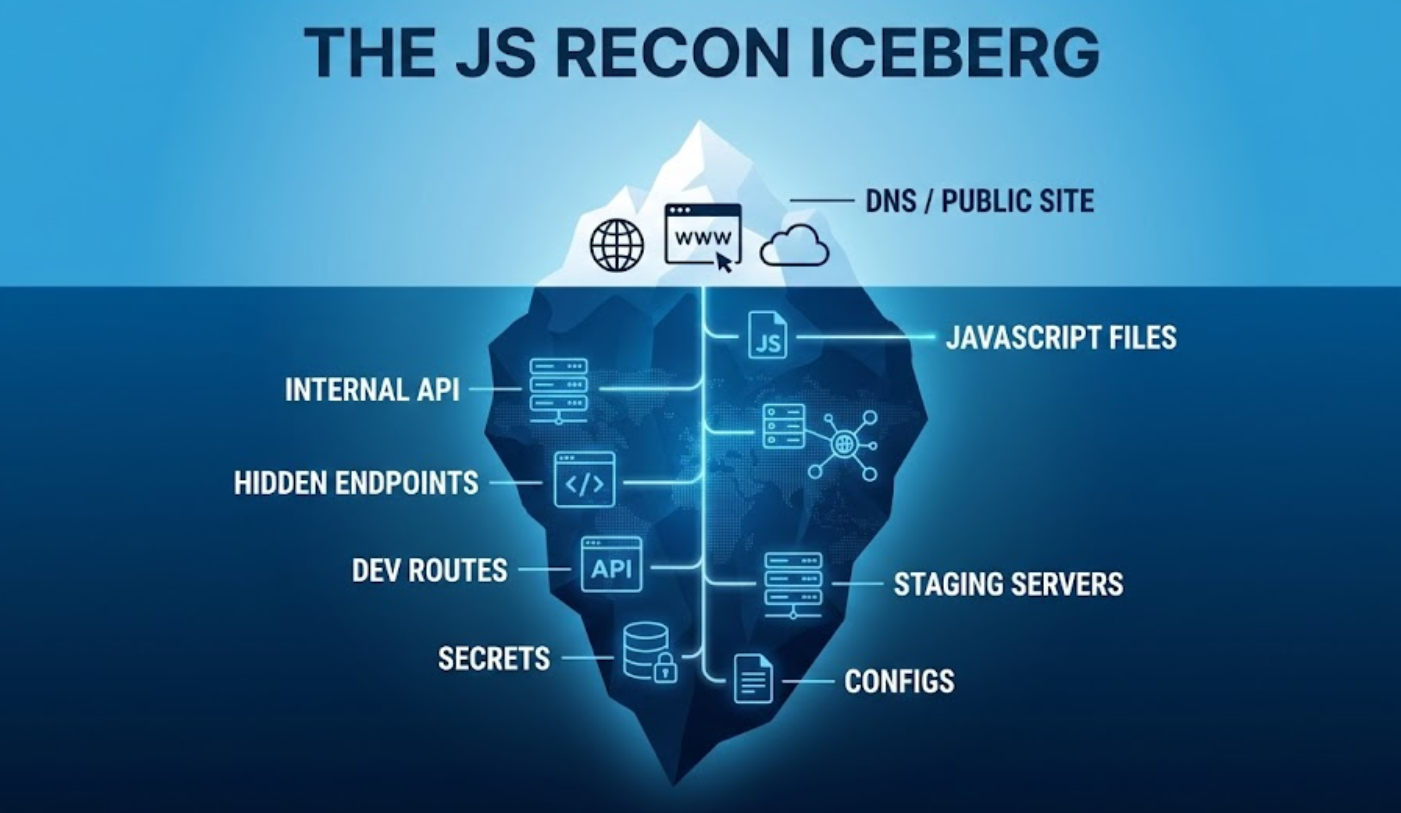
Finding the shadow infrastructure
Let's say you run a subdomain scan and find the usual suspects: www, api, blog. Standard stuff. But here's the thing, that staging-api.corp.com subdomain you're looking for might not have a public DNS record. It might be internal-only or sitting behind a firewall.
But guess what? The production JavaScript might still reference it:
const API_BASE = isDev ? 'staging-api.corp.com' : 'api.corp.com'
Boom. You just found an internal target without ever touching a scanner.
Context over raw data
A port scan tells you that port 443 is open. Cool. But a JavaScript file tells you exactly how to talk to that endpoint. You'll find the expected headers, the JSON structure, hidden query parameters like ?admin=true or ?debug=1, and all the little shortcuts developers left behind for themselves.
The ghost features
This one's my favorite. Developers often "remove" features by just hiding the UI button. But the actual function? Still sitting in the JavaScript bundle. Finding these orphaned functions can lead you straight to IDORs, privilege escalation, or unauthorized actions that were supposed to be disabled but never actually were.
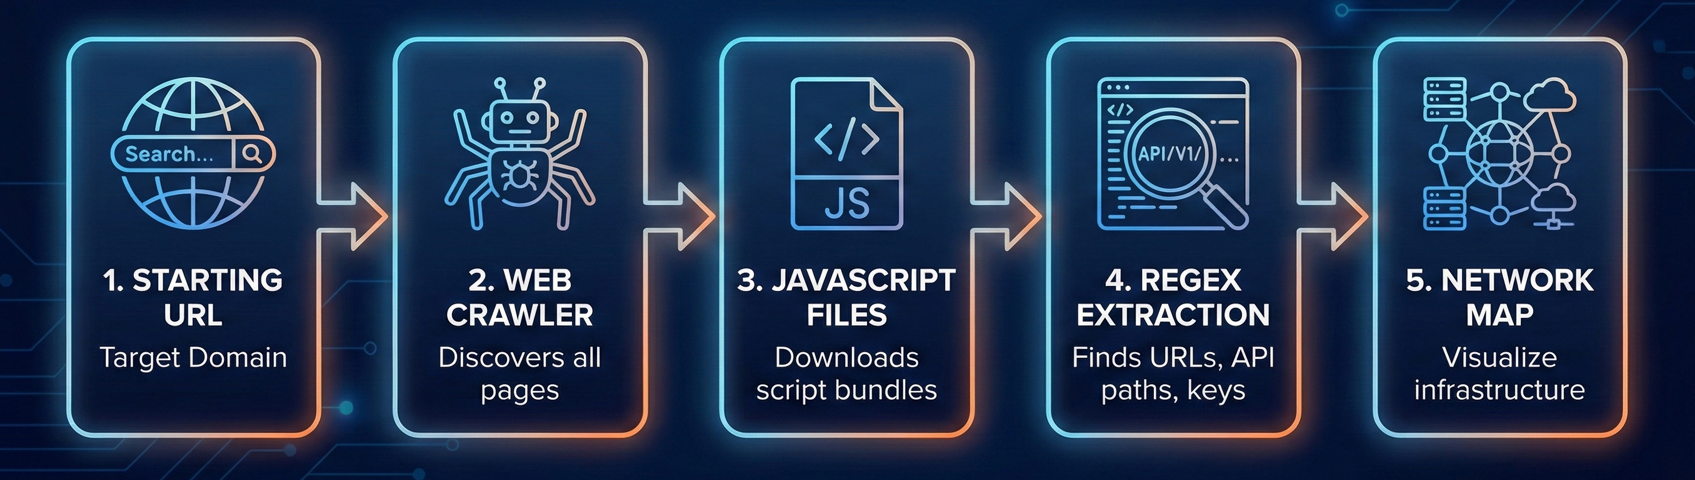
Phase 1: Finding Every JavaScript File
You can't analyze what you don't have. Step one is building a comprehensive inventory of every JavaScript file connected to your target.
Combine active and passive methods
Most people just spider the live site and call it a day. That's leaving gold on the table.
Active spidering means crawling the current, live application:
- Tools like Katana, Hakrawler, or Burp Suite's Spider work great for this
- They'll grab every
<script src="...">tag they can find
Passive archiving is where it gets interesting:
- Use the Wayback Machine and Common Crawl to find historical JavaScript files
- Tools like
waybackurls,gau, andgetJSmake this easy
Why bother with old files? Because that app.v1.js from two years ago might contain a hardcoded API key that was removed from app.v2.js but never rotated. The key's still valid, it's just not in the current code anymore.
The practical workflow
Here's a quick command-line approach:
# Gather all URLs
echo "target.com" | gau | grep "\\.js$" | sort -u > all_js_files.txt

# Check which ones are still alive
cat all_js_files.txt | httpx -mc 200 > live_js_files.txt
Now you've got a list of both current and historical JavaScript files to work with.
The Pre-Requisite: Making the Code Readable
Before we start extracting secrets, we need to address the elephant in the room. When you open a modern main.js file, it usually looks like a solid wall of gibberish.
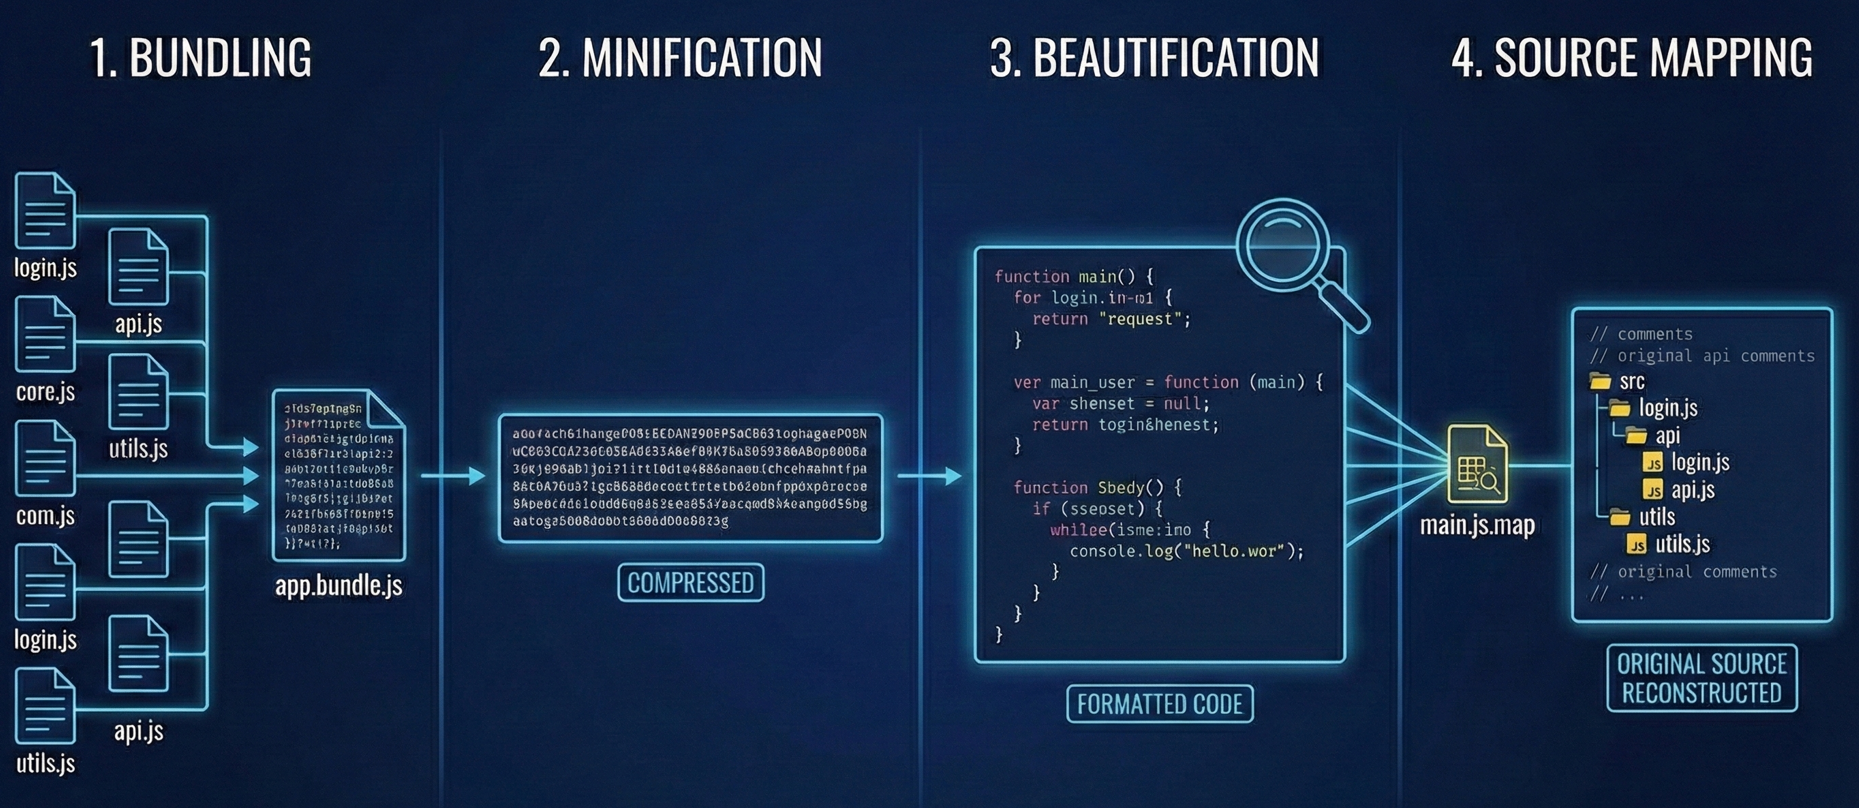
To analyze effectively, you need to understand these key concepts:
1. Bundling Modern apps aren't written in one file. They are written in hundreds of small, organized files. Tools like Webpack or Vite take all those little files and smash them together into one or two massive "bundles" (like app.2893.js) to make the website load faster. This is why you often find unrelated code (like billing logic next to user profile logic) in the same file.
2. Minification Developers want these bundles to be as small as possible. Minification strips out everything computers don't need but humans do: whitespace, newlines, and comments. It also renames descriptive variables like getUserPassword() to single letters like a() or x().
- Note: This isn't encryption. It’s just compression. The logic is still there; it’s just harder to read.
3. Beautification You cannot analyze minified code effectively. If you try to grep a minified file, you’ll get one line of output that is 50,000 characters long. Beautification (or "Pretty Printing") is the process of adding the whitespace and structure back in.
- Tip: Most browser DevTools have a
{}button in the "Sources" tab to do this automatically. - CLI Tip: Tools like
js-beautifyor passing the file through a generic formatter is a mandatory first step before you start manual analysis.
4. Source Mapping Sometimes, you get lucky. To help with debugging, developers often generate a .map file (e.g., main.js.map). This file maps the minified code back to the original source code.
- If you find a source map, you don't need to guess what
function x()does. The map will reconstruct the original file structure, often revealing original variable names and comments like// TODO: Fix vulnerability.
A Note on Obfuscation: Sometimes you will see code that looks intentionally garbled (e.g., _0x4f2a1['\x70\x75\x73\x68']). This is Obfuscation, designed specifically to hide logic from people like us. While tools like Deobfuscator.io can help, don't confuse this with standard minification. Minification is for speed; obfuscation is for secrecy.
Phase 2: Extracting the Good Stuff
Alright, you've got 50MB of minified, ugly JavaScript. Reading it line by line isn't realistic. Time to mine for the valuable bits.
What you're hunting for
Endpoints and routes
This is the jackpot. You're looking for API paths like /api/v1/user/delete or full URLs to other services.
Tools that help:
- LinkFinder: A Python script that uses regex to pull endpoints from JS files
- xnLinkFinder: A faster Go implementation of the same idea
Secrets and API keys
Full AWS root keys are rare these days (thankfully), but you'll often find API keys for third-party services: Algolia, Firebase, Sentry, Stripe test keys, you name it.
Tools that help:
- TruffleHog
- SecretFinder
Hidden parameters
Look for patterns like param=, ?q=, or variable names that scream "debug feature": isAdmin, debugMode, testUser, bypassAuth.
Phase 3: Making Sense of It All
Tools give you raw data. Now it's your job to turn that into actionable intelligence.
Reconstructing the full API
If LinkFinder gives you /api/v1/users/create, don't stop there. Think about what else probably exists:
/api/v1/users/delete/api/v1/users/update/api/v1/users/{id}
Even if these endpoints aren't explicitly referenced in the JavaScript, there's a good chance they exist on the backend. REST APIs follow patterns. Use that to your advantage.
Leveraging Source Maps for Code Reconstruction
This is honestly the best-case scenario. When developers minify their code, they often generate a .map file (like main.js.map) to help with debugging.
If you find one of these, you can reverse-engineer the original source code. You get:
- Unminified, readable JavaScript
- Original variable names
- Directory structure
- Sometimes even developer comments like
// TODO: Fix this security issue later
Always try appending .map to any JavaScript URL you find. You'd be surprised how often it works.
Understanding the tech stack
Look at what third-party services are being called:
sentry.ioreferences? They're tracking errors thereintercom.io? Customer support chat- Some random CDN for a JavaScript library? Possible supply chain attack vector
Knowing the tech stack helps you target your attacks. If they're using an old version of a library with known CVEs, that's your way in.
Phase 4: Continuous Monitoring and Diffing of JavaScript Files
JavaScript files change with every deployment. And here's the thing: new code is less tested code.
If main.js changes today, you shouldn't re-analyze the entire file. Just look at what changed. That 5-line addition where they added a new GraphQL mutation? That's your hunting ground.
New endpoints mean new features. New features mean less battle-tested code. Less battle-tested code means bugs.
A Real Example
Let me give you a scenario I've seen play out:
A researcher is monitoring a target's JavaScript files. One day, a new file appears in Wayback Machine results: admin-panel.bundle.js. Interesting. They try to access it on the live site, 403 Forbidden.
They download the archived version and run it through LinkFinder. One endpoint jumps out: /api/internal/reset-password.
On a hunch, they try this endpoint on the live production API. It works. The admin panel UI was restricted, but the actual API endpoint? Wide open.
That's the power of JavaScript reconnaissance.
How Jsmon Can Help
Look, manual JavaScript analysis is tedious. Running grep across thousands of files creates too much noise. Keeping a historical archive of every script change is nearly impossible if you're doing this solo.
That's why we built Jsmon. It automates the entire workflow:
- Continuous monitoring: We watch your target's JavaScript assets around the clock
- Automatic extraction: We pull out endpoints, secrets, and sensitive parameters for you
- Intelligent diffing: The moment a script changes, you get an alert with exactly what was added or modified
Stop trying to guess what your attack surface looks like. Just read the blueprint they're already giving you.
Secure your business, in real-time.
Further Reading
If you want to dive deeper into JavaScript analysis, these resources are solid: